Run your first simulation
This is the whole path, from an empty list to a finished report. It takes about ten minutes if you have a CSV of your servers to hand.
By the end you will have used every major feature of the Simulations module.
1. Create the simulation
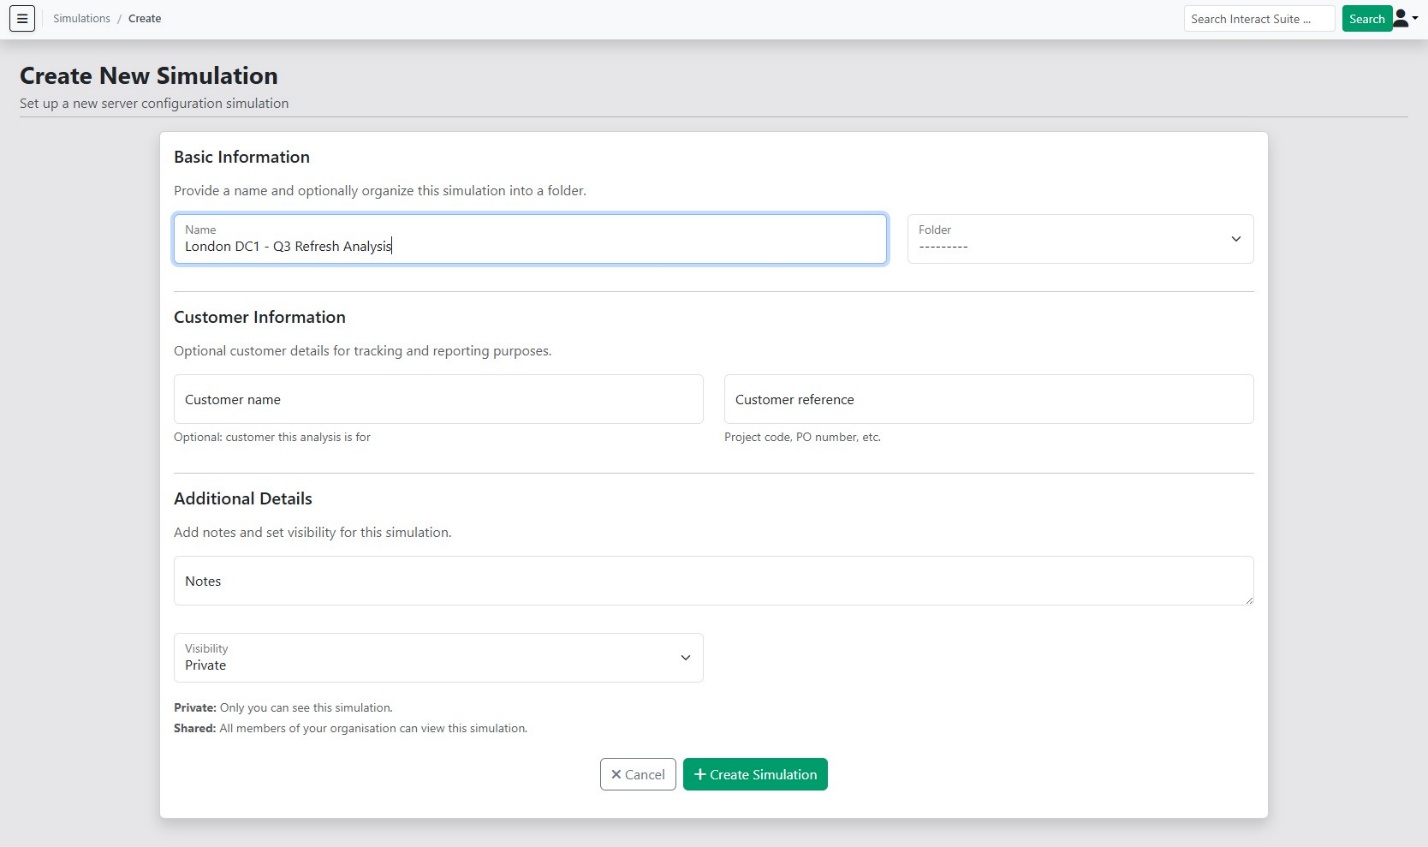
From Simulations, choose New simulation.
Name it. Something you will recognise in six months: the customer, the site, or the question you are answering — "London DC1 — Q3 refresh analysis" rather than "test 2".
Add customer details. Customer name, reference and notes are all optional, but they carry through onto the finished report and make simulations easier to search for later. Fill them in if this is going to a customer.
Choose a folder if you want to keep related work together.
Set visibility. Private keeps it to you; Shared lets your colleagues read it. See Your account.
Choose Create Simulation. You land on the simulation detail page, which is your command centre for everything that follows.
2. Bring in your estate
You need to tell us what servers you run today. There are three ways.
Upload a CSV
The usual choice for anything above a handful of servers. In the Source Specification section, choose Upload CSV and select your file.
Nothing is imported when you upload. You are shown which columns we found and asked to confirm them first, so a wrong guess costs you nothing.
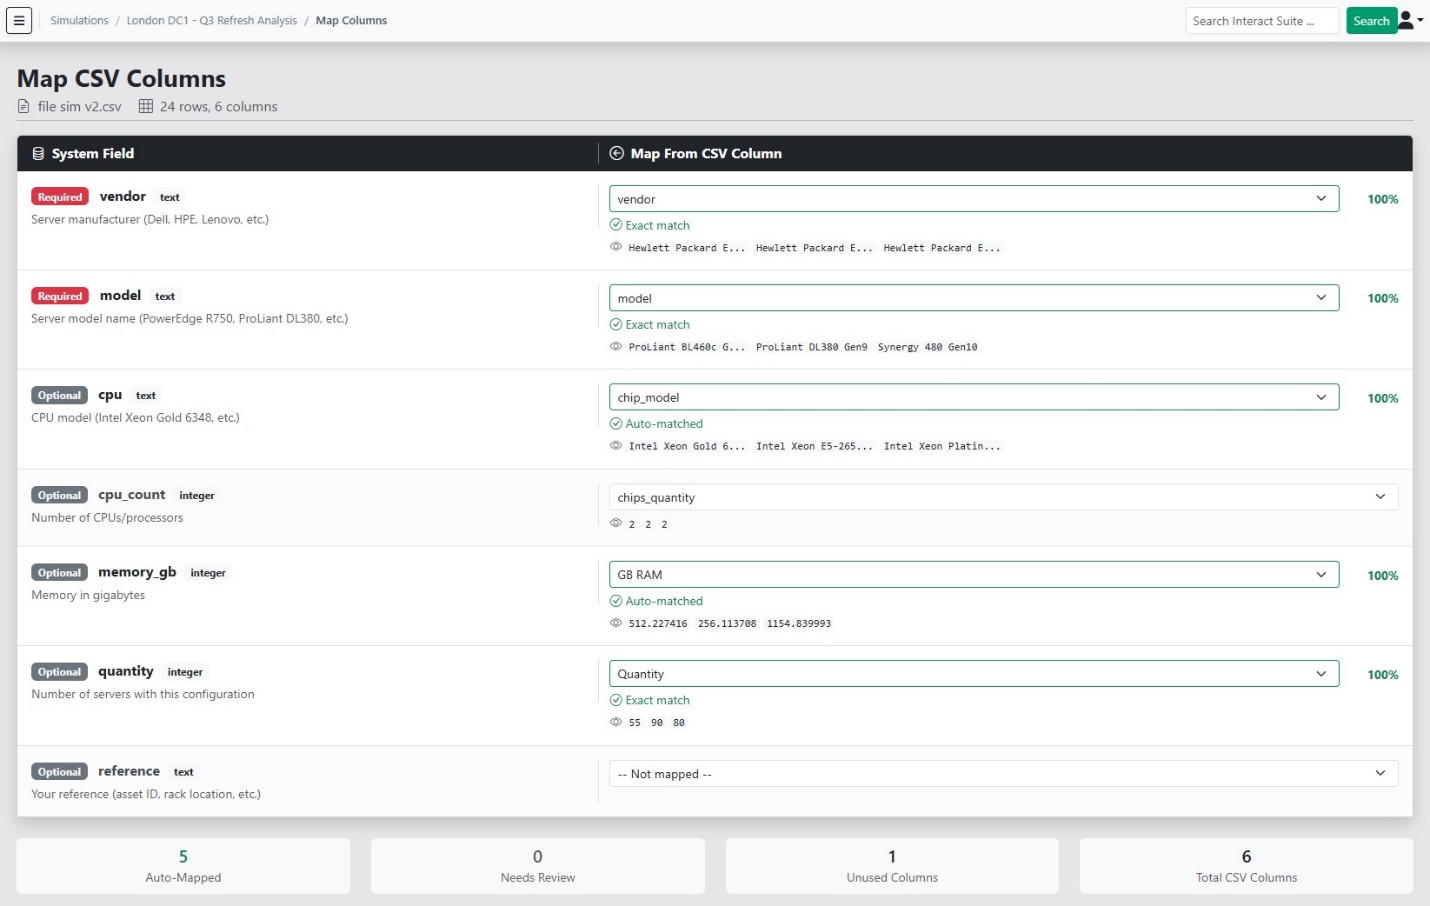
Map each of your headers to the field it holds. Vendor and model are required; CPU, CPU count, memory, quantity and reference are all optional but improve the match. We suggest mappings for headers we recognise.
Choose Confirm Mapping and Import. Matching runs in the background and you are shown its progress.
Use the template if you are starting from scratch
The CSV template linked on the simulation page is already in the right shape, with the expected headers in place.
The full detail is in Importing from CSV.
Add lines by hand
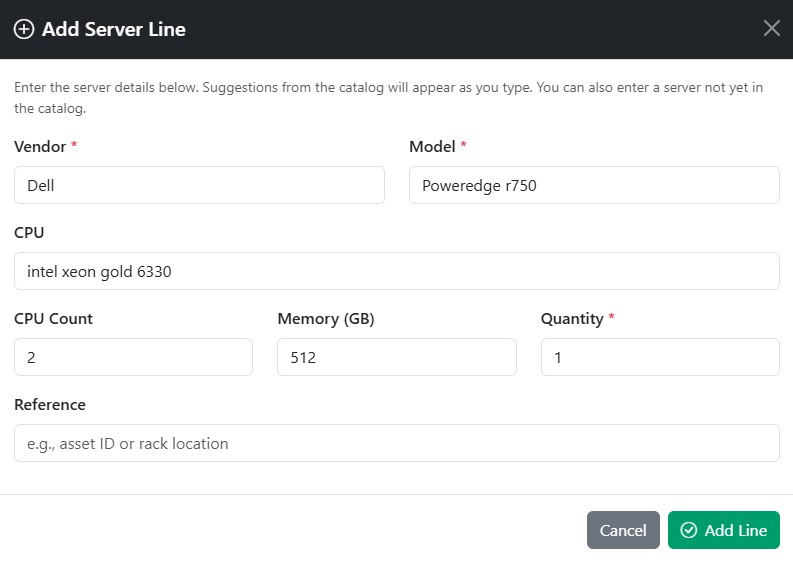
For small estates or one-off additions, choose Add Data and then Add Server Line. Enter vendor, model, CPU, CPU count, memory, quantity and an optional reference.
Suggestions appear from the catalogue as you type, and an indicator tells you whether we recognise the configuration before you save it.
Import from a location
If your organisation uses the Estate module and already has servers registered under a location, choose Import from Location and pick it. Every server there is copied into your specification, so you do not enter anything twice.
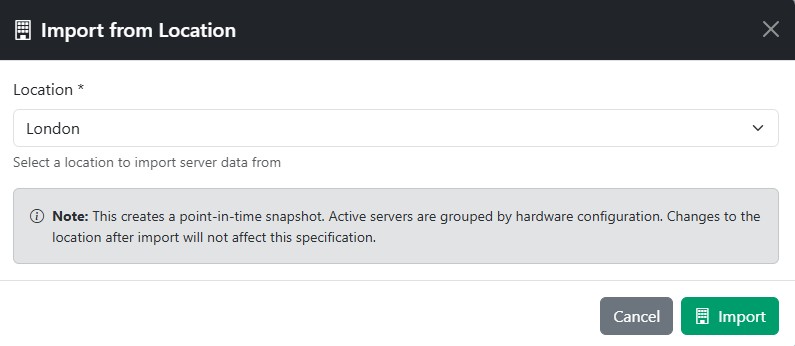
See Locations and estate for what a location is.
3. Check what we matched
Each line is matched against our hardware catalogue. Matching is fuzzy, because inventories rarely spell hardware the way vendors do.
Lines that matched exactly are marked validated and need nothing from you. Lines that matched approximately are queued for review, and a banner appears on the simulation page. Choose Review Matches to work through them.
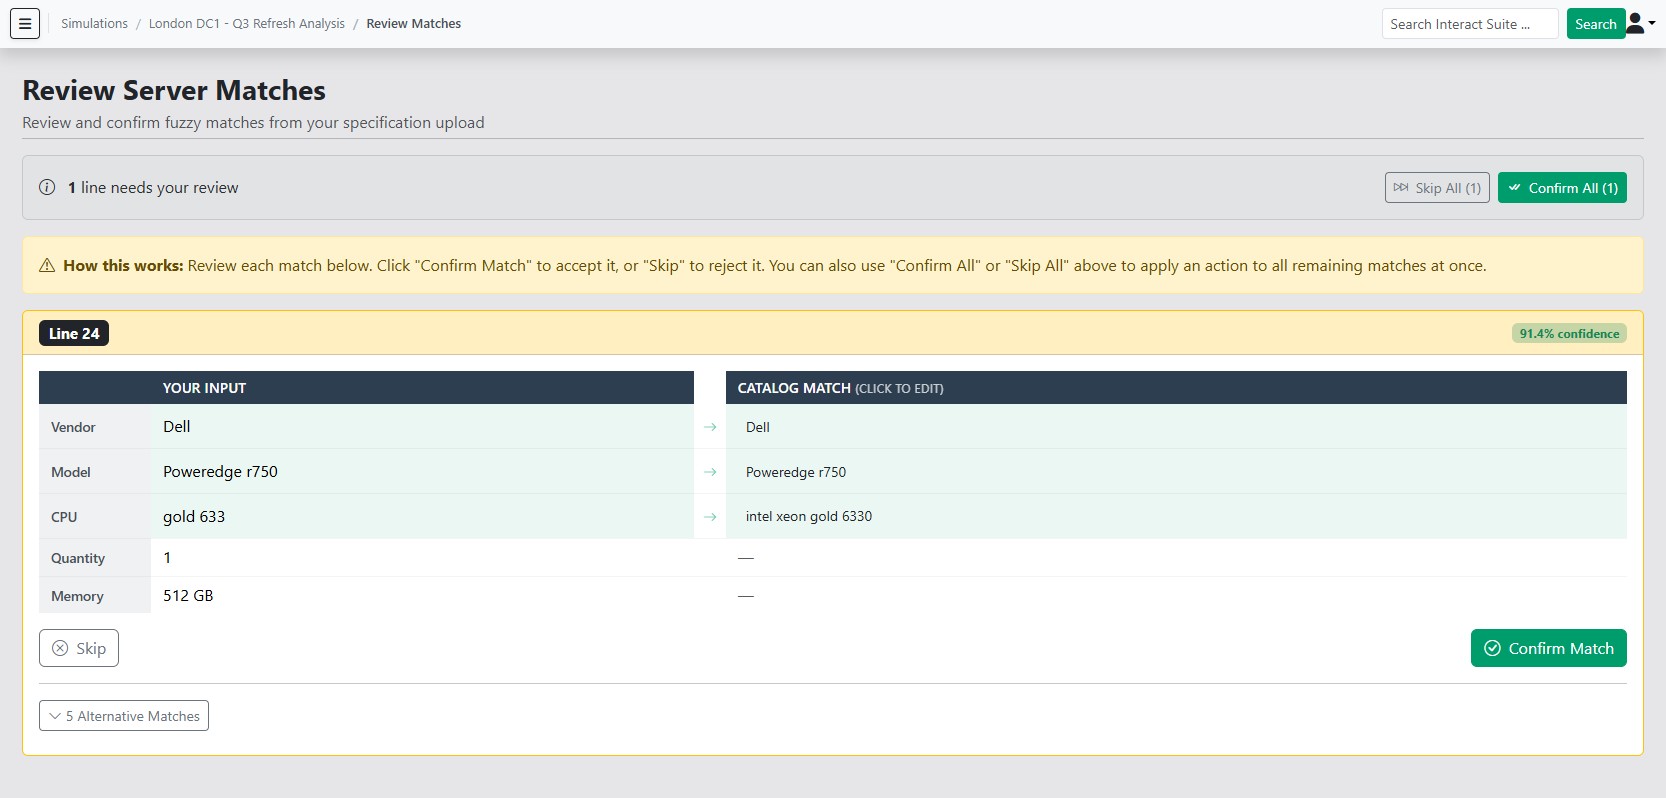
Each card shows your original values, our suggested match, and how confident we are:
- Confirm if the suggestion is right.
- Select Alternative to browse other catalogue entries if it is wrong.
- Skip if the server is not in the catalogue. Skipped lines are left out of the analysis entirely.
Once every line is dealt with, the simulation moves to Ready.
Confirm All when the suggestions look sound
With a long list of reasonable suggestions, Confirm All accepts the lot. You can still come back and correct individual lines afterwards.
See Specifications for how to correct a match later.
4. Choose what to compare against
Scroll to Target Configurations and choose Add Target. Enter the vendor, model and CPU model — suggestions come from the catalogue as you type — then set CPU count and memory.
Once the target resolves, its efficiency grade is shown, so you can see how it compares to your current hardware before you spend anything.
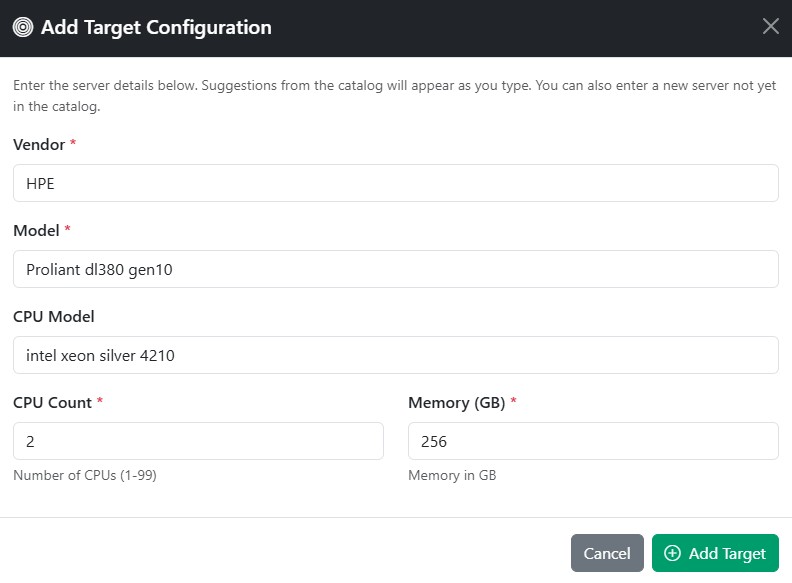
Add as many targets as you like. Each is analysed independently and they appear side by side in the results.
Each target costs one credit per run
Five targets means a run costs five credits. See Credits and billing.
5. Set your own figures
Energy price, maintenance cost per server, and licensing cost per core. Anything you leave blank uses our platform assumption, and the report states plainly which figures were assumed rather than supplied.
Supplying your own energy price is the single change that most improves the accuracy of the cost result.
6. Run it
With a validated specification and at least one target, the simulation is Ready.
Choose the simulation type — see Targets and runs — then Run Simulation. You are taken to a confirmation screen showing how many source servers and targets will be analysed, what it will cost, and what your balance is.
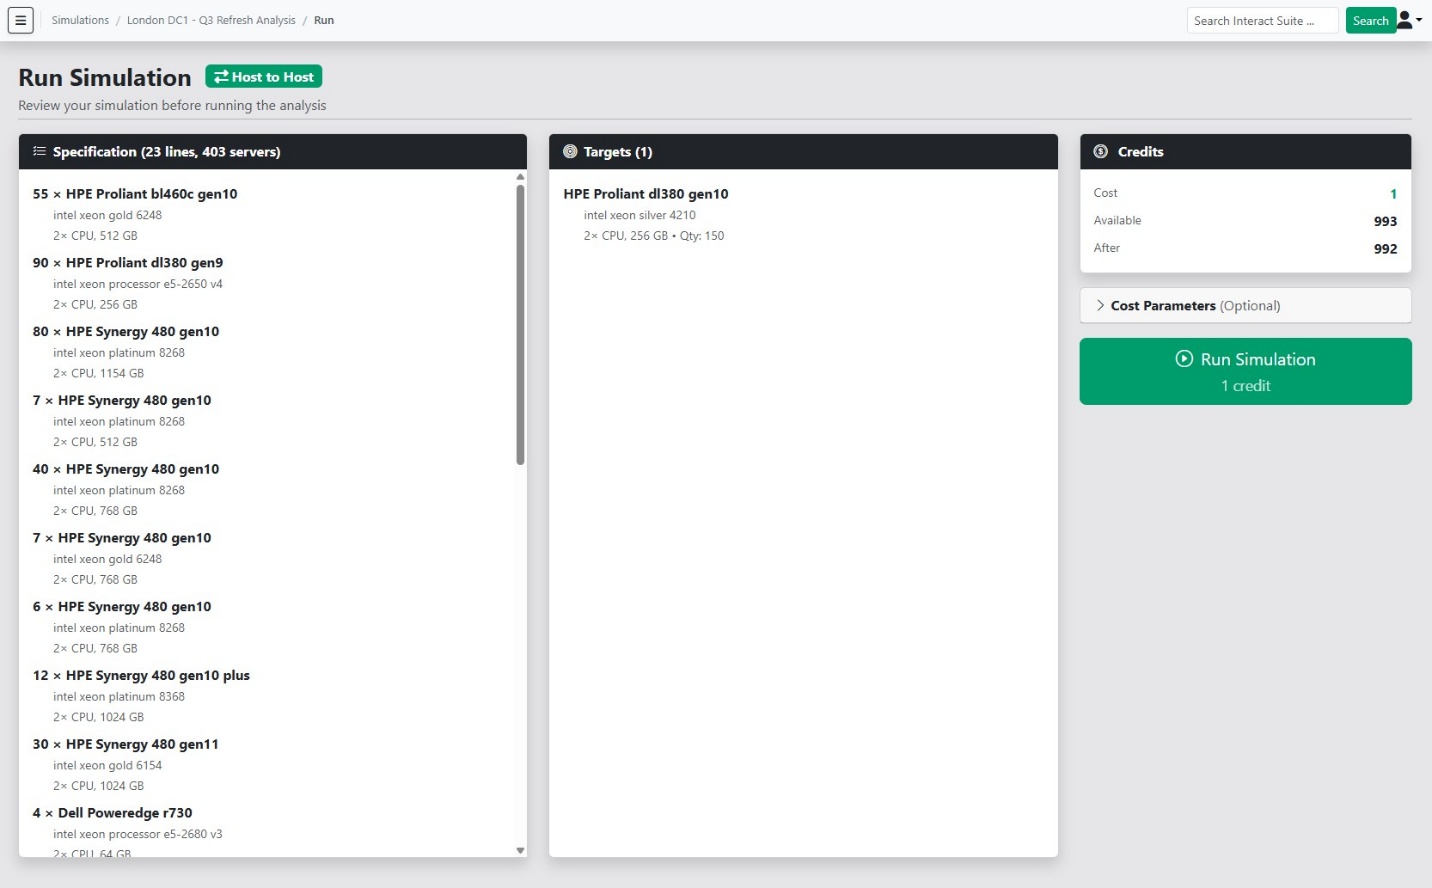
Nothing is charged until you confirm. Credits come off at that point and the analysis starts.
A run usually takes a few minutes. You do not need to stay on the page — the simulation updates itself when the result arrives.
7. Read the result
Results appear on the simulation page and in the run history. For each target you get annual energy reduction, carbon reduction, server consolidation, the new efficiency grade, and operational cost reduction if you set cost parameters — with absolute figures alongside the percentages where we have them.
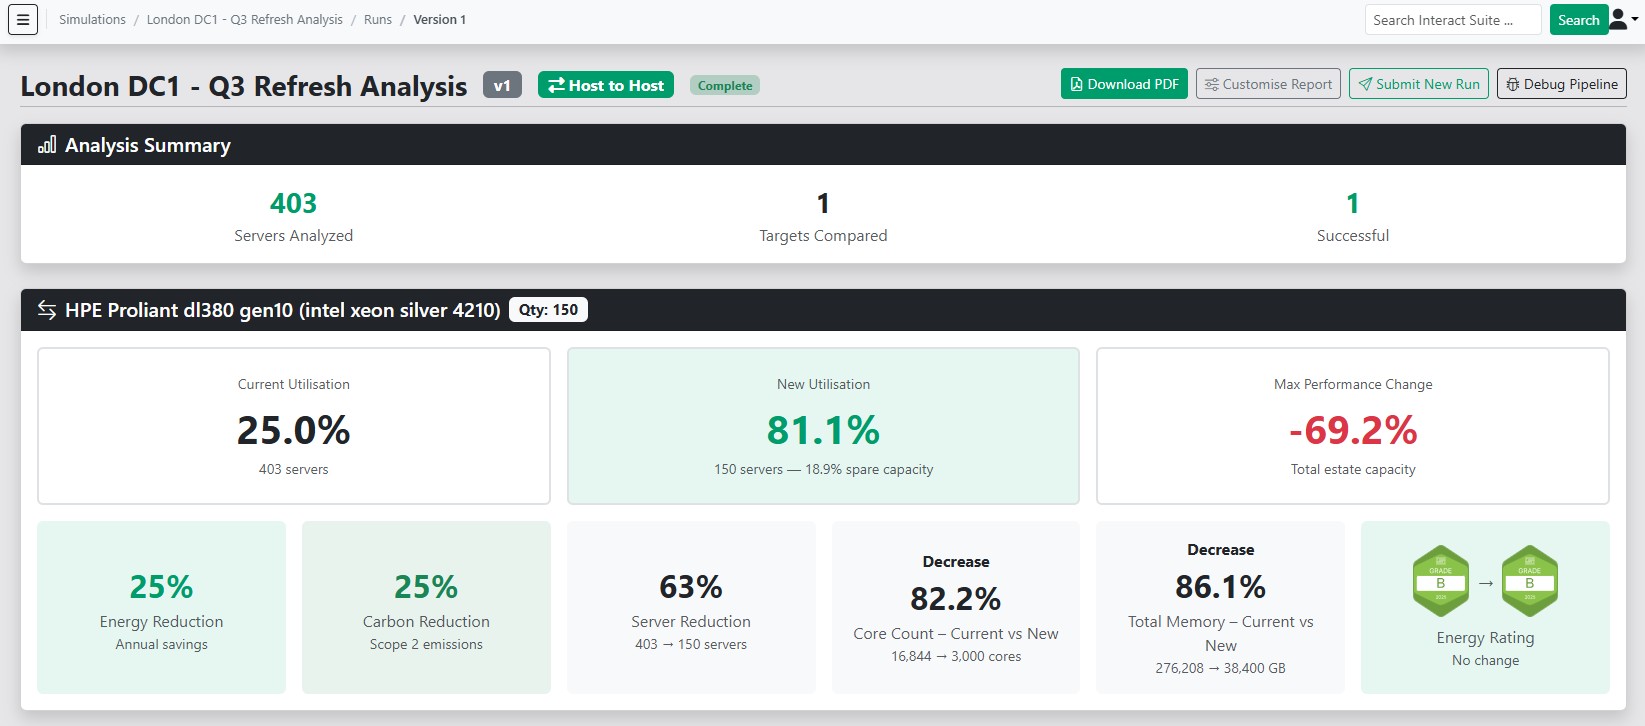
A partly failed run still completes
If some targets fail and others succeed, the run is marked complete and the failed targets are refunded automatically. The error is shown on the target itself.
The full detail is in Reading your results.
8. Generate a report
From the run, choose Generate Report. You can pick which sections to include — cover page, executive summary, source analysis, target comparisons, methodology, about — toggle individual metrics on or off, and add your own notes.
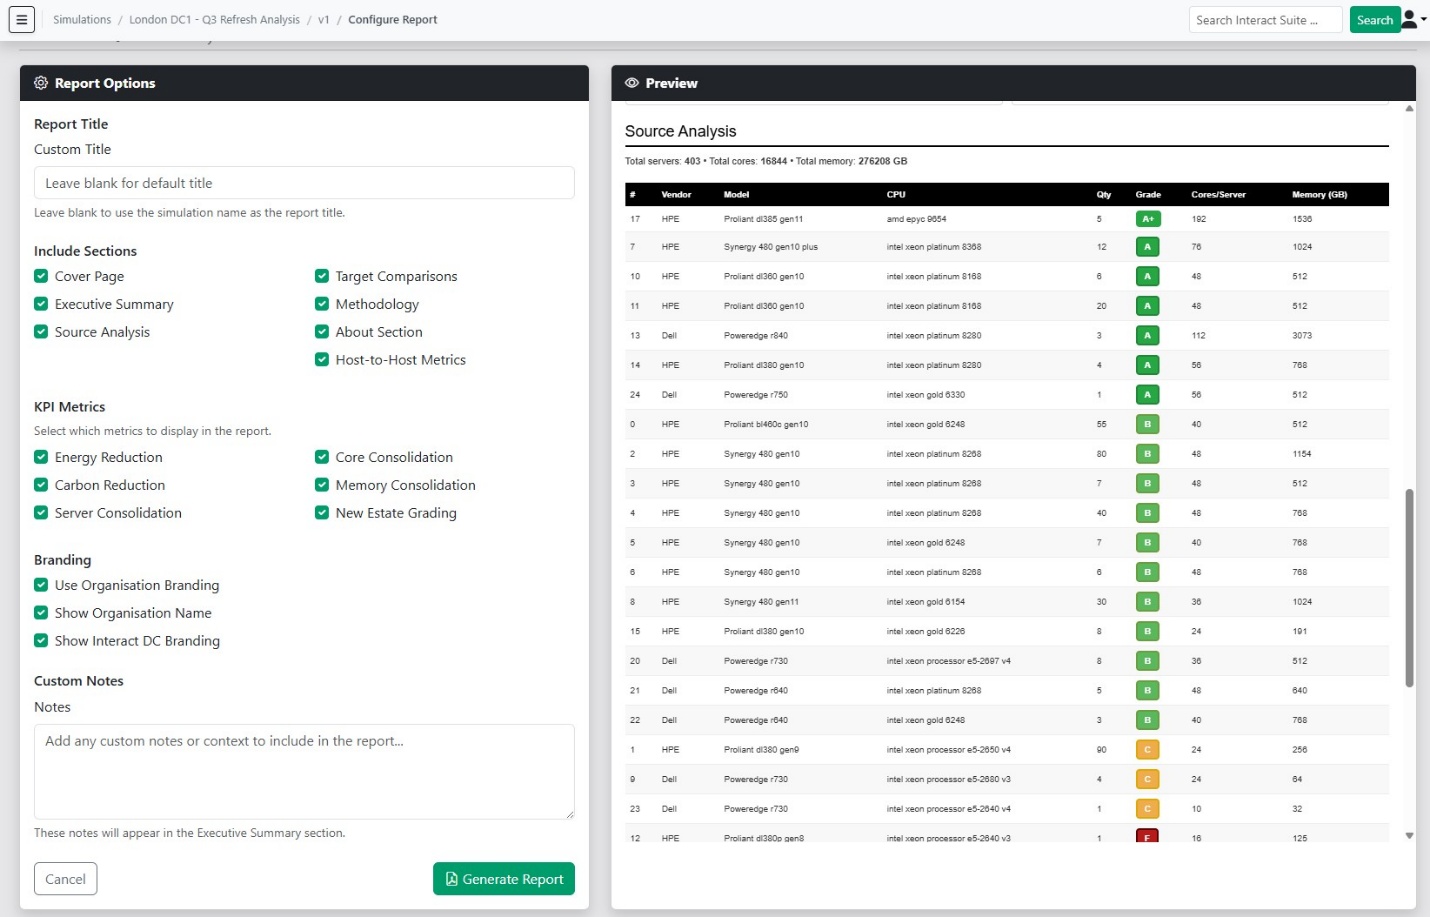
If your organisation has set up branding, the report uses it automatically. Choose Generate, then download the PDF and send it on.
Tip
Quick Generate produces a report with the default settings and no configuration step.
See Reports for what goes into each section.
The same walkthrough runs inside the app
Open the profile menu in the top right and choose Run your first simulation. It points at the real screens as you go.